0 item
CARNIVORE UNIVERSITY
Stock Trading Entry Strategies: 4 Chart Setups We Love
Why You Need Entry Strategies in Trading
Elite traders consistently do a few things right. One of the most important pieces of any trading strategy is picking your entry points. In trading, an entry point is a price at which you buy more stock of a particular trade. Traders pick an entry point based on predetermined rules, defined by their trading strategy. This removes emotion from decision making and protects traders from excessive risk, as long as they have a viable trading strategy they are disciplined enough to follow.
Choosing Your Entry Point: What Kind of Chart Setups Do You Like?
Hey, part of what we’re doing here is helping you look at a stock you might like and see if it has the setup that might be profitable for you. We don’t have the ability – almost nobody does – to see everything – and we sure don’t have a corner on the market for good trading ideas. So one thing we love is when we find out that one of our Carnivores found a stock they like on their own, looked at it in the context of a few things they learned here, and they hit it and made some money. Very cool. The other thing that we love to hear is when the psychology of how you approach stocks – what you think of them – how you handle a loss or a profitable trade – changes over time.
Profitable Entry Strategies Start with Strong Trading Psychology
One of the best things we ever heard was when a CFL said to us.“I used to think that if I bought a stock, it was important that I be right – and if it went down, I got all whacky psychologically about it. It wound me up inside. After becoming a Carnivore, I realized that what you told me was true…the stock doesn’t care about who owns it. It doesn’t care about me. Why should I care about it? It’s just a damn stock! If it’s not doing what I thought it should, why am I spending all this time thinking about it, what to do about it, when I could be spending that energy – that time – looking for something better that is going to make me money, and just kick that ugly bitch of a stock to the curb and move on?”
OK – a little graphic, but that’s how some Carnivores talk.
Including Dutch – I mean, The Rogue, when he’s getting animated and wants to drive a point home.
Here are four of our favorites:
4 High Probability Trading Chart Patterns We Love
So, how do successful traders identify their entry and exit points? They start by choosing a small number of high-probability chart patterns they want to look for as their setup. Here are four setups we love to see when looking for our entry points.
THE ASCENDING TRIANGLE
At Carnivore University, we love seeing things like the Ascending Triangle pattern. A lot. In this bullish trading pattern, the top can be moving up a bit also – it doesn’t have to be flat – but what’s important is that the lower trend line should be moving up like depicted. Nice strong angle closing the gap, heading to a “resolution point” and resolution date. Whoopie, we love that. It’s easy to see and to understand. When the Ascending Triangle pattern is tightening, and the stock is almost visibly coiling in front of you, it’s getting ready to explode, right? And if there are the right fundamentals and market tone, if the sector is good, and the stars align just right, this setup chart pattern can give you explosive moves up.
Here’s one of our past picks that was in an ascending triangle pattern.
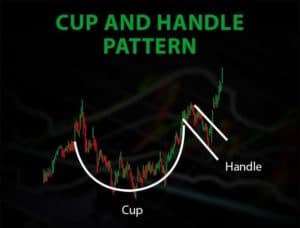
THE CUP AND HANDLE
It’s simple to see the cup and the handle. It’s harder to see as it develops and find. You have to be looking for it.
THE RIGHTEOUSLY TRENDING STRONG RSI STOCK
One of Dutch’s favorites.
He likes that these stocks just kind of trade “the way they should,”not all over the place.
An identifiable trend, identifiable pattern, identifiable rising channel upper and lower.
And the bonus is that while they go up kind of nice and slow, doing their thing, you can get a breakout, but our experience is that these can break either way and often do, so we want targets and time frames here….and leverage into them as they rise “righteously.”Does not produce as many explosive breakouts, but also doesn’t produce as much heartburn. A good example of this kind of stock that we recently traded was AVTR and WIT and ATEN.
THE WASHED OUT COMING OFF A BOTTOM STOCK
Some stocks have been so destroyed that they’re washed out.
The wash-out is complete when virtually everyone has given up on the stocks, the volume indicators show that everyone has been selling like crazy, and those indicators cannot go much lower.
You want to enter these, especially if they’re off 80 or 90% from their high prints, and they are in a good or popular sector, as this one is, in the “future” of energy.
This stock could go lower, and maybe by a lot, but it seems to be rallying here and might be good for a trade, but we use it as an example for the Washed Out Coming Off the Bottom Pattern.
Dutch always gives you such pretty charts!
Like what you see? Learn about out stock picking strategy and trade alerts for swing traders →


